How Much Do Homes Cost in Chicago? September 2026 Prices by Neighborhood
The Chicago housing market tells a very different story depending on which neighborhood you look at, with average sale prices ranging from $415,000 to over $613,000 across five key community areas as of September 2026. If you want to know where prices are rising fastest, where they've cooled, and what your budget can realistically get you, the neighborhood-level data is where to start.
Key Takeaways
Average sale prices across five tracked Chicago neighborhoods range from $415,000 (Near West Side) to $613,313 (Lower West Side/Pilsen) as of September 2026.
Pilsen posted the strongest year-over-year growth at +16.3%, making it the clearest price-growth story in the current dataset.
Near West Side is the only tracked neighborhood showing a year-over-year price decline, down 1.2%.
The Loop and Near North Side are performing steadily, each posting year-over-year gains near 5.6 to 5.7%.
Bridgeport offers a relatively accessible entry point among detached single-family neighborhoods, with an average sale price of $588,750 and +2.4% annual growth.
Neighborhood-level data consistently outperforms citywide averages as a decision-making tool for buyers, sellers, and investors.

Why Citywide Averages Don't Tell the Full Story
Headline figures about the Chicago real estate market tend to flatten out what is actually a collection of very distinct, hyper-local markets. A neighborhood where prices just climbed 16% and a neighborhood where prices dipped 1.2% will both feed into the same citywide average, making both look moderate when neither one is.
That's why the data below focuses on five specific community areas using InfoSparks figures from September 2026. Each figure reflects the property type most commonly transacted in that area, whether that's attached single-family, detached single-family, or all property types combined. Understanding that distinction matters before comparing numbers across neighborhoods.
September 2026 Chicago Neighborhood Average Sale Prices
The table below summarizes average sale prices and year-over-year changes across five Chicago community areas tracked through InfoSparks as of September 2026.
| Neighborhood | Average Sale Price | YoY Change | Property Type Tracked |
|---|---|---|---|
| Near West Side | $415,000 | -1.2% | Attached Single-Family |
| Lower West Side (Pilsen) | $613,313 | +16.3% | Detached Single-Family |
| The Loop | $422,950 | +5.7% | All Property Types |
| Near North Side | $467,500 | +5.6% | All Property Types |
| Bridgeport | $588,750 | +2.4% | Detached Single-Family |
One important note on methodology: because these five figures mix attached single-family, detached single-family, and all property types, direct price comparisons between neighborhoods should be made carefully. You're not always comparing apples to apples, and that context shapes how you read the numbers.
Pilsen and the Lower West Side: The Strongest Price Growth in the Dataset
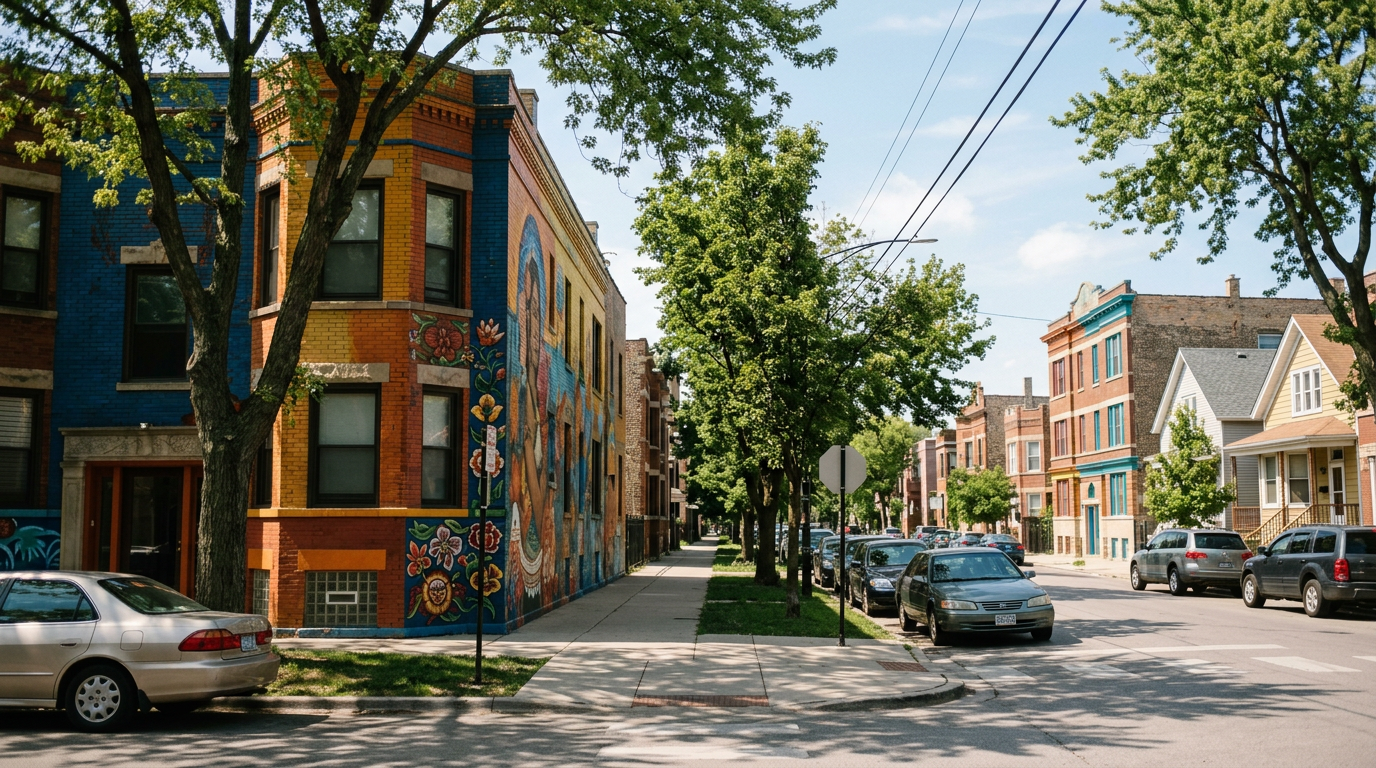
The Lower West Side, which most Chicagoans and homebuyers know as Pilsen, recorded the highest average sale price in this dataset at $613,313 and the strongest year-over-year growth at +16.3%. These figures reflect detached single-family sales, which tend to be more consistent and comparable month over month.
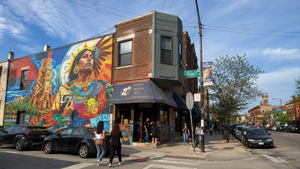
Pilsen has been attracting significant buyer attention for several years now, driven by its arts scene, proximity to the 18th Street Pink Line station, strong community identity, and relative affordability compared to neighborhoods closer to the lake. The +16.3% annual increase signals that buyer demand has outpaced available inventory in a meaningful way.
Zillow maintains a dedicated Pilsen housing market page, which confirms that this neighborhood has enough search volume and transaction activity to warrant its own market tracking. That level of platform attention generally reflects genuine buyer interest, not just local hype.
If you're a seller in Pilsen, September 2026 data strongly favors your position. If you're a buyer, expect competitive offers and limited negotiating room on well-priced detached homes.
Near West Side: Steady Inventory, Slight Price Softening
The Near West Side came in at $415,000 for attached single-family properties, reflecting a -1.2% year-over-year dip. It is the only neighborhood in this dataset showing a negative annual change, though the decline is modest rather than dramatic.
Near West Side covers a large and diverse geographic footprint that includes parts of the Illinois Medical District, Greektown, and areas adjacent to the United Center. Because attached single-family homes, including condos and townhomes, are the primary property type tracked here, this figure reflects condo-market conditions more than detached house values.
A slight price correction in an attached single-family market often reflects a shift in supply/demand balance rather than a fundamental problem with the neighborhood. Buyers looking in this area may find slightly more room to negotiate than they would in Pilsen or Bridgeport right now.
The Loop: Consistent Gains Across All Property Types
The Loop posted an average sale price of $422,950 with a +5.7% year-over-year increase. Because this figure covers all property types, it reflects a broad cross-section of what transacts in Chicago's central business district, primarily condos and high-rise units.
The Loop's market has evolved considerably over the past decade as more residential development has taken root in what was historically a commercial core. For buyers interested in walkable urban living with easy access to the Metra, CTA, and lakefront, Loop condos remain one of the more attainable downtown entry points.
For a granular look at what a specific budget gets you in this part of the city, the what $3,500 rents Loop downtown Chicago breakdown gives real-world context for what price points look like in practice.
Near North Side: A Broad Market With Deep Neighborhoods
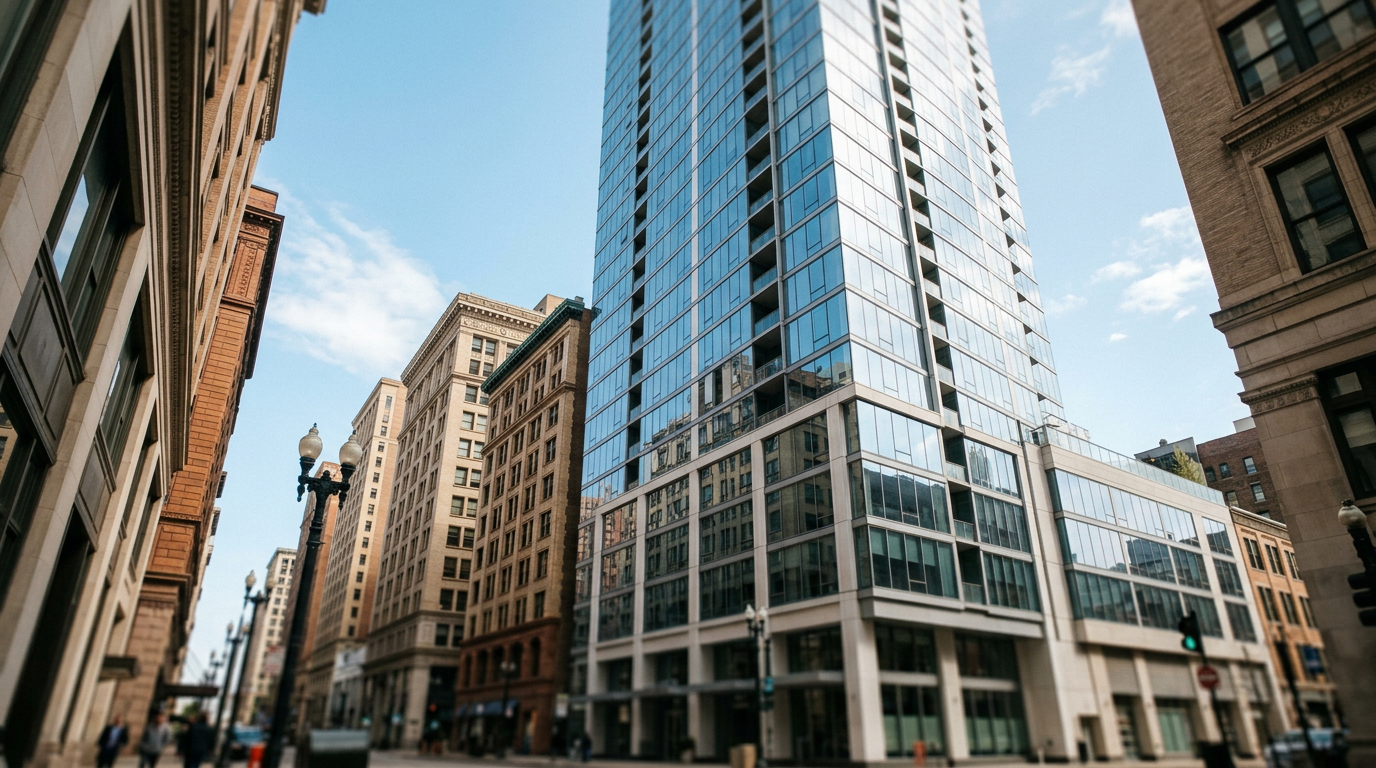
The Near North Side recorded an average sale price of $467,500 across all property types, with a +5.6% year-over-year gain. This is one of Chicago's most geographically and demographically diverse community areas, encompassing parts of River North, Streeterville, Gold Coast, and Old Town.
Because the Near North Side InfoSparks figure covers all property types across such a wide footprint, it is best used as a directional indicator rather than a precise price point for any single sub-neighborhood. Gold Coast condos and River North lofts, for example, occupy very different price tiers within the same community area code.
What the +5.6% year-over-year growth does tell you is that demand across the Near North Side remains healthy and that prices are moving upward at a pace broadly consistent with The Loop. Buyers evaluating this area should expect competition, particularly for well-located units near the Red Line or the lakefront.
Bridgeport: Detached Single-Family Value on the South Side
Bridgeport came in at $588,750 for detached single-family homes, with a +2.4% year-over-year gain. That price point reflects a neighborhood where you can still purchase a standalone house for under $600,000, which increasingly puts Bridgeport in an attractive position relative to the North Side.
Bridgeport has a strong residential identity rooted in Chicago's South Side working-class history, and it continues to attract buyers who prioritize house size, yard space, and neighborhood stability over proximity to downtown. The detached single-family focus in this dataset makes Bridgeport's figure directly comparable to Pilsen's, which makes the $613,313 vs. $588,750 comparison particularly useful for buyers weighing both neighborhoods.
For buyers also evaluating rental economics nearby, the what $2,200 rents South Loop Chicago breakdown provides useful context on the adjacent rental market, which can inform investment decisions in and around Bridgeport.
What Renters Are Seeing Nearby
Not everyone entering Chicago's market right now is buying. Rental prices in neighborhoods adjacent to these five community areas provide useful context for buyers who are deciding whether to continue renting or make the leap to ownership.
For buyers exploring the University Commons area specifically, the what $3,200 rents University Commons Chicago breakdown gives a realistic picture of what rental dollars look like in that part of the Near West Side. Cory Tanzer, CEO and founder of the Cory Tanzer Group at Option Premier, is deeply embedded in the University Village and University Commons community and has firsthand knowledge of how rental and ownership economics interact in that specific area.
How to Use This Data as a Buyer or Seller
The numbers above give you a starting framework, but raw averages don't account for property condition, exact block location, lot size, unit floor, or the specific motivations of each buyer and seller involved in a transaction.
Here's a practical way to use this data:
As a buyer: Use neighborhood averages to shortlist where your budget is competitive, then work with an agent to narrow to specific blocks and property types.
As a seller: Compare your neighborhood's year-over-year trend to understand whether you're in a favorable or neutral market before setting your list price.
As an investor: Pay attention to the spread between appreciation rates in adjacent neighborhoods like Pilsen (+16.3%) and Near West Side (-1.2%), since that divergence often signals where capital is flowing next.
As a renter considering ownership: Compare your monthly rent against ownership costs in the same neighborhood using current mortgage rate assumptions from sources like Freddie Mac's Primary Mortgage Market Survey.

Talk to a Chicago Neighborhood Expert Before You Make Your Next Move
The September 2026 data is clear: neighborhood selection in Chicago can mean the difference between buying into a +16.3% appreciation story or a market that's quietly softening. Whether you're buying your first home, selling an investment property, or trying to figure out where your budget actually goes the furthest, the right guidance at the right moment changes outcomes in a measurable way. Reach out to Cory Tanzer of the Cory Tanzer Group at Option Premier by calling (312) 218-4483 or emailing cory@optionpremier.com, and get a conversation grounded in real neighborhood-level data, not citywide averages that blur the picture.
Frequently Asked Questions
-
Pilsen, also known as the Lower West Side, posted the strongest year-over-year price growth at +16.3%, with an average sale price of $613,313 for detached single-family homes.
That increase stands well above any other neighborhood tracked in this dataset and reflects sustained buyer demand that has consistently outpaced available inventory in the area. Pilsen's combination of cultural identity, transit access via the Pink Line, and relative affordability compared to lakefront neighborhoods has made it one of the more compelling appreciation stories in the current Chicago housing market. Buyers entering Pilsen now should expect competitive conditions, particularly on well-maintained detached homes.
-
The Near West Side remains a viable option for buyers, though its -1.2% year-over-year price dip for attached single-family properties signals a slight softening in that specific segment of the market.
The neighborhood itself covers a large and diverse footprint that includes Greektown, the Illinois Medical District, and areas near the United Center, giving buyers a wide range of lifestyle and commute considerations. The modest price decline may actually create a small window of negotiating room that buyers would not find in faster-appreciating neighborhoods like Pilsen or Bridgeport. Working with an agent who knows the specific blocks within the Near West Side is the most reliable way to identify where value is concentrated right now.
-
Both Bridgeport and Pilsen track detached single-family home sales, making them directly comparable: Bridgeport averages $588,750 with +2.4% annual growth, while Pilsen averages $613,313 with +16.3% annual growth.
Bridgeport offers a slightly lower entry price point and a more modest appreciation rate, which may appeal to buyers who prioritize stability over aggressive price movement. Pilsen's stronger appreciation makes it more attractive from a short-term equity-building perspective, but that growth also means less room to negotiate and more competition at the offer table. The right choice between the two ultimately depends on your timeline, budget flexibility, and whether you're buying primarily as a place to live or as an investment vehicle.
-
At the September 2026 average sale price of $467,500, a Near North Side buyer is most likely looking at a condo or attached unit, since that figure covers all property types across a large and varied community area.
The Near North Side encompasses neighborhoods like River North, Streeterville, Old Town, and parts of Gold Coast, each of which carries its own price tier within the broader community area average. A $467,500 budget will go further in some sub-neighborhoods than others, and unit size, floor level, building amenities, and proximity to transit all affect where that number lands in practice. Connecting with a local agent before narrowing your search is the most efficient way to match your budget to the right building and block.
-
The fastest starting point is an online home valuation tool, which uses recent comparable sales data to estimate your property's current market value based on location, size, and property type.
Option Premier offers a dedicated home valuation tool at optionpremier.com that gives Chicago homeowners a data-driven baseline before they engage with an agent or decide on a listing strategy. That said, automated valuations work best as a starting point rather than a final answer, since they can't account for property condition, recent renovations, or hyper-local demand patterns that an experienced agent would catch during a walkthrough. For a more precise picture, especially in a market where neighborhood-level trends vary as widely as they do across Chicago right now, a conversation with a local expert is worth the time.
The Bottom Line on the Chicago Housing Market
Neighborhood selection is one of the most consequential decisions a Chicago buyer or seller makes, and September 2026 data reinforces exactly why. A 17-percentage-point gap in year-over-year appreciation between the best-performing and worst-performing neighborhoods in this dataset is not a rounding error. It reflects real differences in supply, demand, buyer demographics, and long-term neighborhood trajectory that no citywide average can capture.
Whether you're drawn to Pilsen's appreciation momentum, Bridgeport's detached single-family stability, or the steady gains playing out across the Loop and Near North Side, the next step is the same: connect with someone who knows these neighborhoods at the block level. Call the Cory Tanzer Group at Option Premier at (312) 218-4483, visit optionpremier.com, or stop by the office at 1021 W Adams St, Suite 200-300, Chicago, IL 60607 to start a conversation grounded in current, neighborhood-specific data.