Chicago Neighborhood Home Prices: July 2026 Single-Family Sales Data
Chicago neighborhood home prices vary significantly from block to block, with average sale prices for single-family homes ranging from the low $400,000s in some areas to well above $600,000 in others as of July 2026. If you are buying, selling, or investing in Chicago right now, knowing where prices stand, and which direction they are trending, gives you a real edge at the negotiating table.
Key Takeaways
Single-family home prices across Chicago neighborhoods moved upward in July 2026, with several areas posting double-digit year-over-year gains.
Bridgeport and Lower West Side led the city in price growth, both exceeding 12% year-over-year appreciation on detached single-family homes.
The Loop and Near West Side remained among the more accessible price points for attached product, while the Near North Side held steady as a premium market.
Buyers should factor in property type (attached vs. detached) when comparing neighborhood averages, since they often reflect very different buyer pools.
July 2026 is an active seller's market in most Chicago neighborhoods, so buyers need to move with a clear strategy.

Why July 2026 Is a Pivotal Moment for Chicago Buyers and Sellers
The Chicago housing market has been anything but predictable over the past few years. Inventory tightness, shifting interest rates, and neighbourhood-by-neighbourhood demand swings have created a market where reading the data at the neighbourhood level is more important than ever. Looking at citywide averages alone can mislead you, because a $450,000 average might be a screaming deal in Lincoln Park and an ambitious ask in Portage Park.
According to National Association of Realtors housing market data, urban markets with diverse housing stock tend to see the widest price spreads across sub-markets, which is exactly what Chicago delivers. The city's 77 officially designated community areas function almost like separate housing markets stacked inside one metro, and for anyone currently planning a move, our July 2026 Chicago Housing Market post breaks down broader conditions alongside this neighborhood-level data, so those two resources work well together.
The Data Source Behind These Numbers
The figures in this article come from InfoSparks, a real estate market analytics platform that pulls data from MLS transaction records. The metric we are working with is average sale price for single-family homes, which includes both attached and detached product depending on the neighborhood segment being tracked. Average sale price and median sale price are different calculations, and we are specifically working with averages here, so keep that in mind when comparing these figures to other sources.
July 2026 Average Sale Prices Across Chicago Neighborhoods
Here is a snapshot of the most recent InfoSparks data for selected Chicago community areas, showing average sale price, year-over-year change, and property type tracked.
| Community Area | Average Sale Price | YoY Change | Property Type |
|---|---|---|---|
| Near West Side | $423,500 | +2.7% | Attached Single-Family |
| Lower West Side | $572,000 | +12.2% | Detached Single-Family |
| Loop | $411,750 | +1.7% | All Property Types |
| Near North Side | $455,000 | +3.4% | All Property Types |
| Bridgeport | $589,000 | +13.3% | Detached Single-Family |
A few things stand out immediately when you read this table. First, the neighborhoods with the highest price growth, Bridgeport and Lower West Side, are both tracked on detached single-family homes. Detached product in Chicago tends to be less abundant and commands stronger appreciation when demand picks up. Second, the Loop's relatively flat growth reflects a condo-heavy market that has been slower to appreciate than residential neighborhoods with yard-and-porch housing stock.

Breaking Down the Neighborhoods: What the Numbers Mean for You
Near West Side and the Loop: Accessible Entry Points With Steady Gains
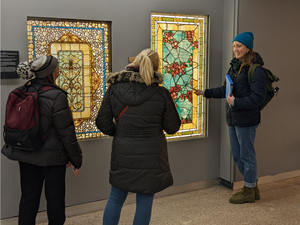
At $423,500 for attached single-family homes, the Near West Side remains one of the more accessible price points for buyers targeting the city's inner ring. The 2.7% year-over-year gain is modest compared to Bridgeport, but it reflects a stable, low-volatility market that attracts first-time buyers and investors looking for predictable appreciation. The neighborhood is home to University Village and University Commons, which Cory Tanzer of the Cory Tanzer Group at Option Premier knows particularly well, and Cory has built a strong reputation in University Village as someone often referred to as the "Mayor of University Village" because of his deep neighborhood involvement and presence there.
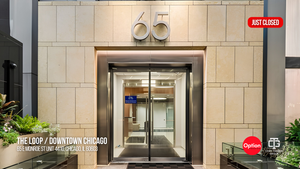
The Loop clocks in at $411,750 across all property types with just 1.7% growth year over year. This market skews heavily toward condominiums and attached product, which explains the lower price point relative to neighborhoods with more detached inventory. Buyers who want walkable urban living without a detached home price tag will find the Loop segment worth watching.
Near North Side: Premium Location, Steady Demand
The Near North Side's $455,000 average across all property types reflects its reputation as one of Chicago's more desirable urban addresses. At +3.4% year over year, demand is consistent without the volatility you see in up-and-coming markets. Neighborhoods like River North and Streeterville pull buyers from high-income professional households, and inventory tends to move quickly, especially for those considering moving to chicago from out of state who are scoping out urban options in our resource that walks through lifestyle, neighborhood culture, and what to expect from the buying process.
Bridgeport and Lower West Side: The Appreciation Leaders
The biggest story in this data set is the double-digit appreciation in Bridgeport (+13.3%) and Lower West Side (+12.2%). Both neighborhoods are tracked on detached single-family homes, which signals that families and long-term buyers are competing hard for scarce standalone inventory.
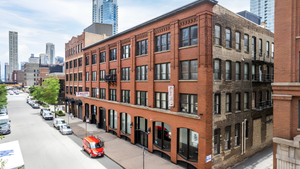
Bridgeport has historically been a working-class neighborhood with a strong sense of community identity. As buyers priced out of Lincoln Park, Lakeview, and West Town migrate south and west, Bridgeport has absorbed significant demand. The $589,000 average sale price is notable because it suggests the neighborhood has crossed a threshold that would have seemed improbable five years ago.
Lower West Side, which includes Pilsen, has seen consistent upward pressure as Pilsen continues its transformation into one of Chicago's most sought-after cultural neighborhoods. At $572,000 for detached single-family homes with 12.2% year-over-year growth, this is one of the hotter submarkets in the city, and Zillow's Chicago market research shows consistent appreciation trends in south and west Chicago neighborhoods as buyer demand diversifies beyond the traditional North Side corridors, which aligns with what we are seeing in this data.
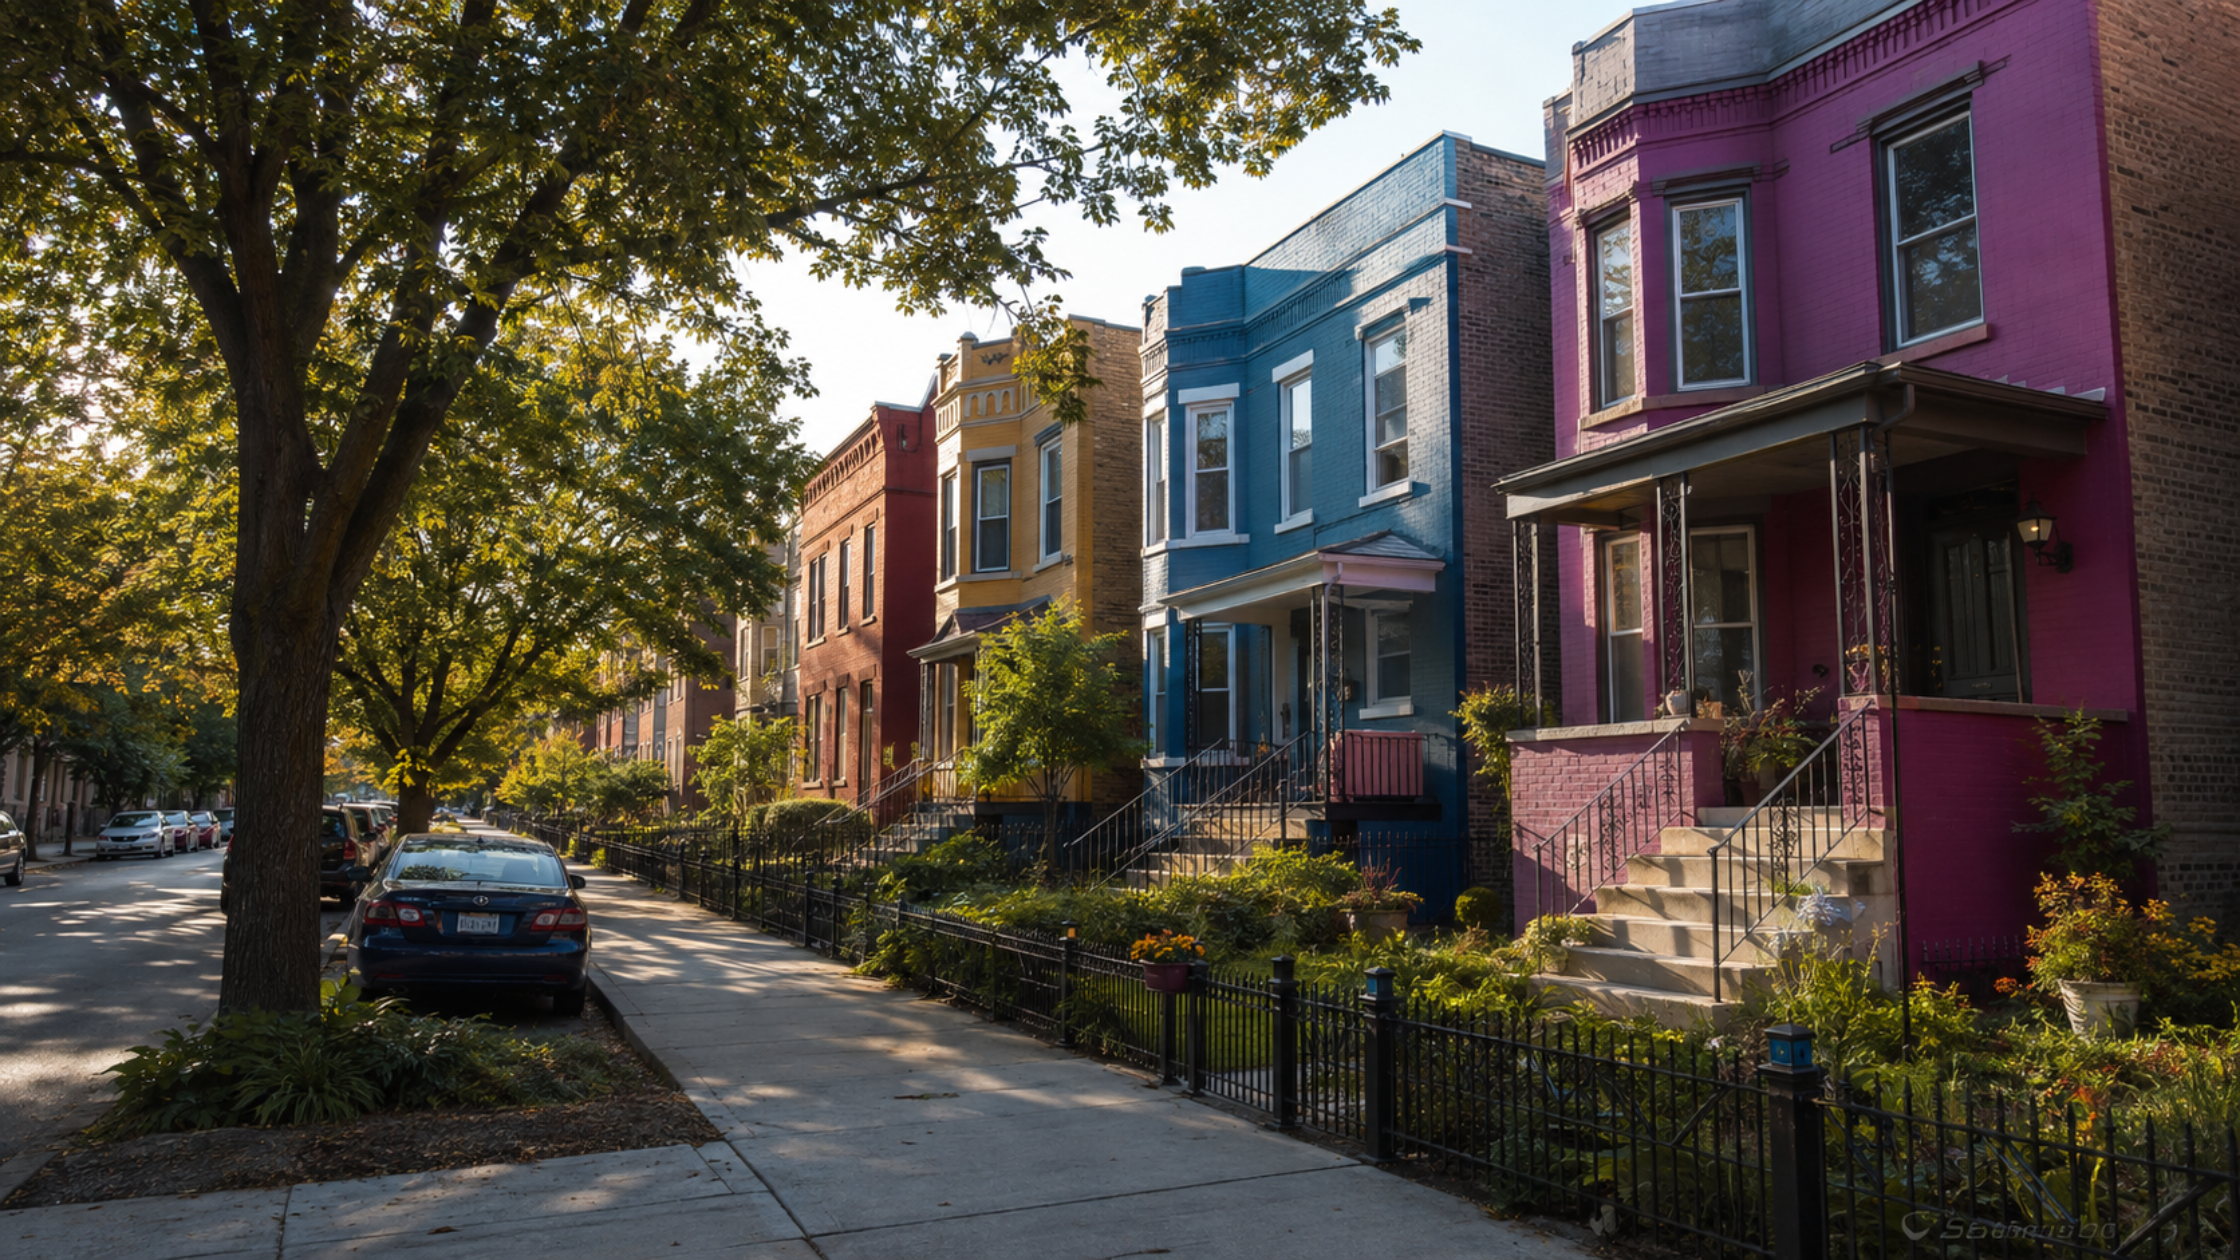
Neighborhoods Beyond the Table: What the Data Doesn't Show
The five community areas in the InfoSparks snapshot above represent just a fraction of the 77 Chicago neighborhoods tracked by MLS data. Here is what broader market research tells us about other high-activity neighborhoods right now.
North Side Markets:
Lincoln Park and Lakeview single-family homes have historically traded in the $700,000 to $900,000+ range for detached product, with strong competition in the summer months.
Logan Square has been one of the most discussed markets for younger buyers, with average prices for detached homes pushing past $600,000 in recent years.
Lincoln Square and North Center attract families looking for strong school access and neighborhood walkability, typically at $550,000 to $750,000 for detached product.
Northwest Side Markets:
Portage Park and Jefferson Park offer some of the most affordable single-family inventory within Chicago city limits, with many bungalows and two-flats trading between $350,000 and $475,000.
Edison Park, Chicago's northernmost neighborhood, operates almost like a suburban market within city boundaries, with detached homes frequently in the $400,000 to $550,000 range.
According to Redfin's Chicago housing market data, the northwest side neighborhoods have seen increased buyer activity from households relocating from higher-priced north side communities, which tracks with the affordability story we see playing out citywide.
Things to Know
Average vs. median matters. The figures in this article are average sale prices, not median. A single high-price sale can pull an average up meaningfully, so always ask your agent for more context around the data.
Property type shifts the comparison. Attached and detached single-family homes are different products. Comparing a Bridgeport detached average to a Loop attached average is like comparing apples to oranges.
Year-over-year changes reflect 12-month windows. A 13% jump doesn't mean prices jumped 13% in a single month. It reflects where average prices landed relative to the same period one year earlier.
Summer is typically Chicago's busiest season. July data often reflects peak competition, which can push averages higher than the fall or winter data will show.
Inventory levels vary dramatically by neighborhood. Tight inventory in Bridgeport or Lower West Side explains much of the appreciation story, not just buyer demand.
Chicago property taxes are a real cost factor. Illinois property taxes are among the highest in the nation according to Tax Foundation property tax data, and they should factor into your true cost of ownership analysis alongside purchase price.
How to Use Neighborhood Price Data When Buying or Selling
If you are buying, neighborhood price data tells you whether you are walking into a competitive market or a slower one. In Bridgeport right now, a 13.3% appreciation rate signals you should expect multiple offers and quick decision windows. In the Loop, a 1.7% rate gives you more room to negotiate.
If you are selling, knowing your neighborhood's trajectory helps you and your agent price accurately. Underpricing in a hot market like Lower West Side means leaving money on the table. Overpricing in a flatter market like the Loop means sitting on inventory while carrying costs accumulate.
You can get a real-time sense of where your home fits in the local market by running a home valuation through Option Premier's website. It's a useful first step before you commit to a listing strategy or make an offer. Our blogs section also covers neighborhood-specific updates regularly for anyone who wants to stay current between market reports, and according to the Chicago Association of Realtors, ongoing inventory constraints across many city neighborhoods are expected to sustain upward price pressure through the remainder of 2026, which aligns with what the July data is already showing.

Take the Next Step With the Cory Tanzer Group
Chicago neighborhood home prices are moving fast in some areas and holding steady in others, and timing your decision around accurate, current data makes a meaningful difference in the outcome. Whether you are trying to break into a competitive neighborhood like Bridgeport, find value on the Northwest Side, or price a home you have owned for years, working with a team that lives and breathes these numbers daily is the clearest path to a strong result.
Call the Cory Tanzer Group at Option Premier today at (312) 218-4483 and let Cory and the team walk you through exactly what the data means for your specific situation.
Frequently Asked Questions
-
Average home prices in Chicago vary significantly by neighborhood and property type, ranging roughly from the low $400,000s to well above $600,000 for single-family homes.
The figures in this article reflect InfoSparks average sale price data for specific community areas. The citywide average blends all these markets together, so neighborhood-level data gives a much clearer picture for buyers and sellers making actual decisions.
-
Bridgeport and Lower West Side led the city with year-over-year gains of 13.3% and 12.2% respectively, both tracked on detached single-family homes.
These gains reflect tight inventory and growing buyer demand in neighborhoods that have historically been more affordable than the North Side. Both markets are moving quickly and require buyers to be decisive.
-
Yes, detached single-family homes generally command higher prices and appreciate faster in Chicago due to their scarcity within city boundaries.
Attached products like townhomes and rowhouses trade at lower average prices but offer urban walkability at a more accessible entry point. The Near West Side and Loop data in this article both reflect attached or mixed product, which is why their averages are lower.
-
July 2026 is an active market with rising prices in many neighborhoods, which means buyers who wait may face higher prices but also benefit from slightly more stable interest rates.
The right time to buy depends on your personal financial readiness and neighborhood target. Fast-appreciating areas like Bridgeport reward early action, while slower markets like the Loop give buyers more negotiating room.
-
The fastest way to get a sense of your home's current market value is to request a professional valuation from a local brokerage that tracks your specific neighborhood.
Option Premier offers a home valuation tool on its website, and the Cory Tanzer Group team can provide a full comparative market analysis using current MLS transaction data for your neighborhood.
The Bottom Line on Chicago Neighborhood Home Prices
The July 2026 data makes one thing clear: Chicago's housing market is not one market, it's dozens of them running side by side. Bridgeport and Lower West Side are sprinting. The Loop is walking at a steady pace. The Near North Side holds its premium with quiet consistency. Understanding which market you are operating in, and what the current average sale price actually signals for buyers and sellers, is the difference between a confident move and a costly mistake.
If you are ready to make a move in Chicago, reach out to Option Premier at (312) 500-5808 or connect directly with Cory Tanzer at (312) 218-4483. The Cory Tanzer Group at Option Premier is ready to help you read the market and act on it.